

How do we compare?
Are aircraft accidents really up in 2021?

On the great advice of a new friend, Dr Kevin Stillwagon (you can find his amazing substack HERE), we need to find out if there truly has been an increase in aircraft accidents in 2021. So in this post I will be presenting the data comparing each month to the same month in 2019, the last year of normal data we have.
I tried to find where I can compare flight hours flown by the public by month, but all I was able to find was the comparison by year. We know that the airlines took a big hit from 2019 to 2020, but it seems that General Aviation and part 135 wasn’t hit as hard, the comparison was 25,566,000 flight hours for 2019, and 22,492,000 for 2020 (source). That’s still a difference of 3.074 million. Numbers weren’t available yet for 2021. If anyone finds a source where the numbers are broken down by month, please let me know.
How am I running these searches? In the CAROL Database located at : https://data.ntsb.gov/carol-main-public/basic-search
What fields I’m filling out: event date, United States, mode: Aviation.
January 1st through 31st 2019 search results: 65
January 1st through 31st 2021 search results: 52
February 1st through 28th 2019 search results: 59
February 1st through 28th 2021 search results: 67
March 1st through 31st 2019 search results: 100
March 1st through 31st 2021 search results: 91
April 1st through 30th 2019 search results: 96
April 1st through 30th 2021 search results: 93
May 1st through 31st 2019 search results: 133
May 1st through 31st 2021 search results: 122
June 1st through 30th 2019 search results: 174
June 1st through 30th 2021 search results: 131
July 1st through 31st 2019 search results: 154
July 1st through 31st 2021 search results: 149
August 1st through 31st 2019 search results: 131
August 1st through 31st 2021 search results: 116
September 1st through 30th 2019 search results: 129
September 1st through 30th 2021 search results: 134
October 1st through 31st 2019 search results: 116
October 1st through 31st 2021 search results: 105
November 1st through 30th 2019 search results: 73
November 1st through 30th 2021 search results: 87
December 1st through 31st 2019 search results: 74
December 1st through 31st 2021 search results: 76
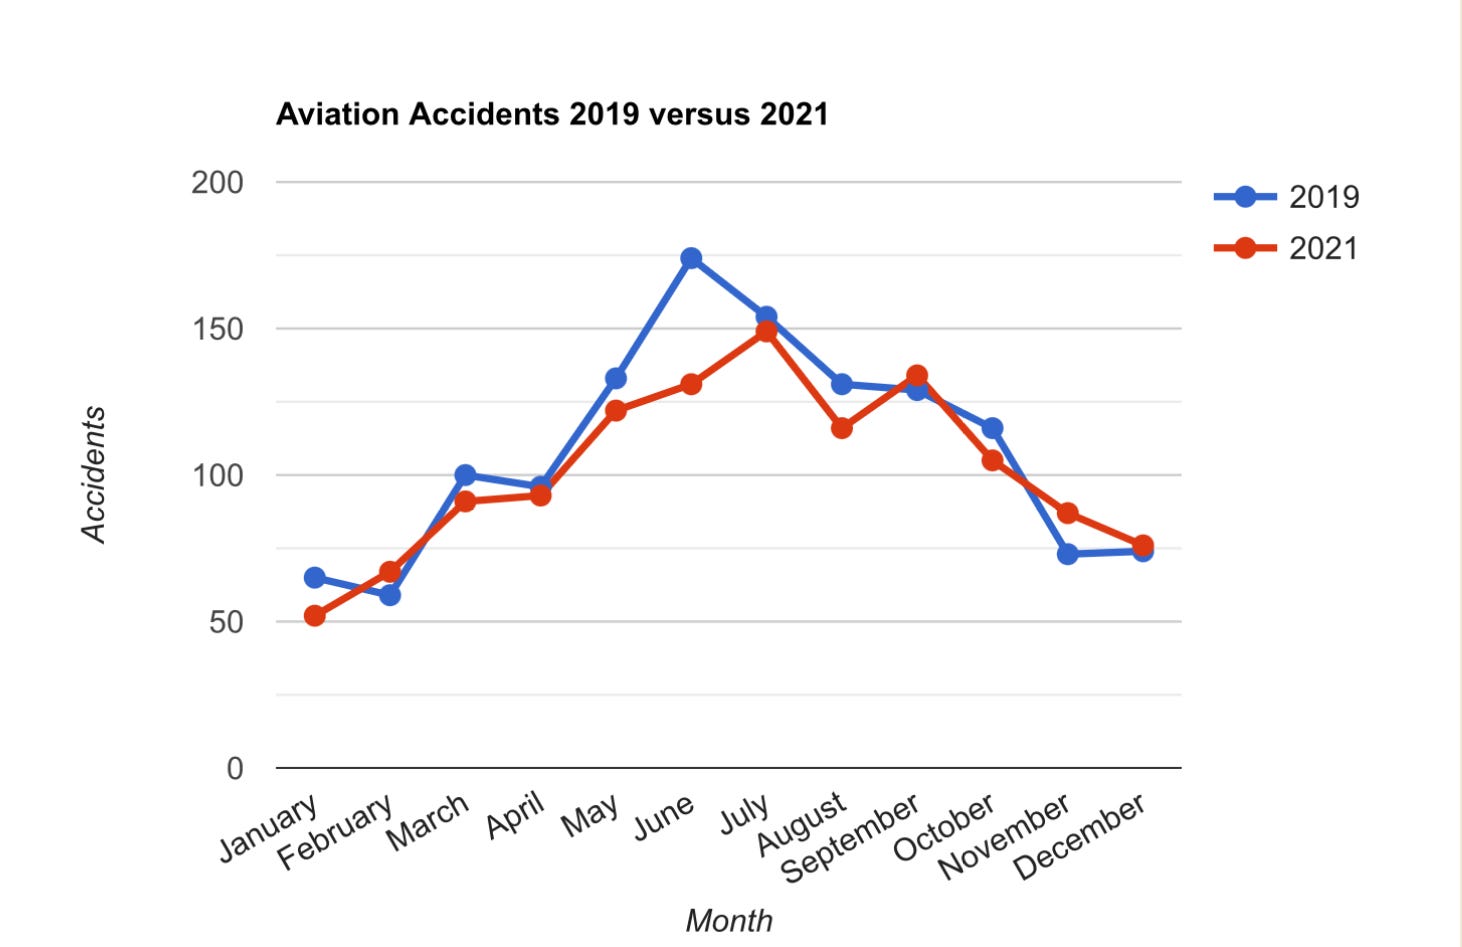
It’s interesting plotting the two years against each other, as they’re very similar. It’s unfortunate that we don’t have the flight hours yet for 2021, so we could really get a good comparison.
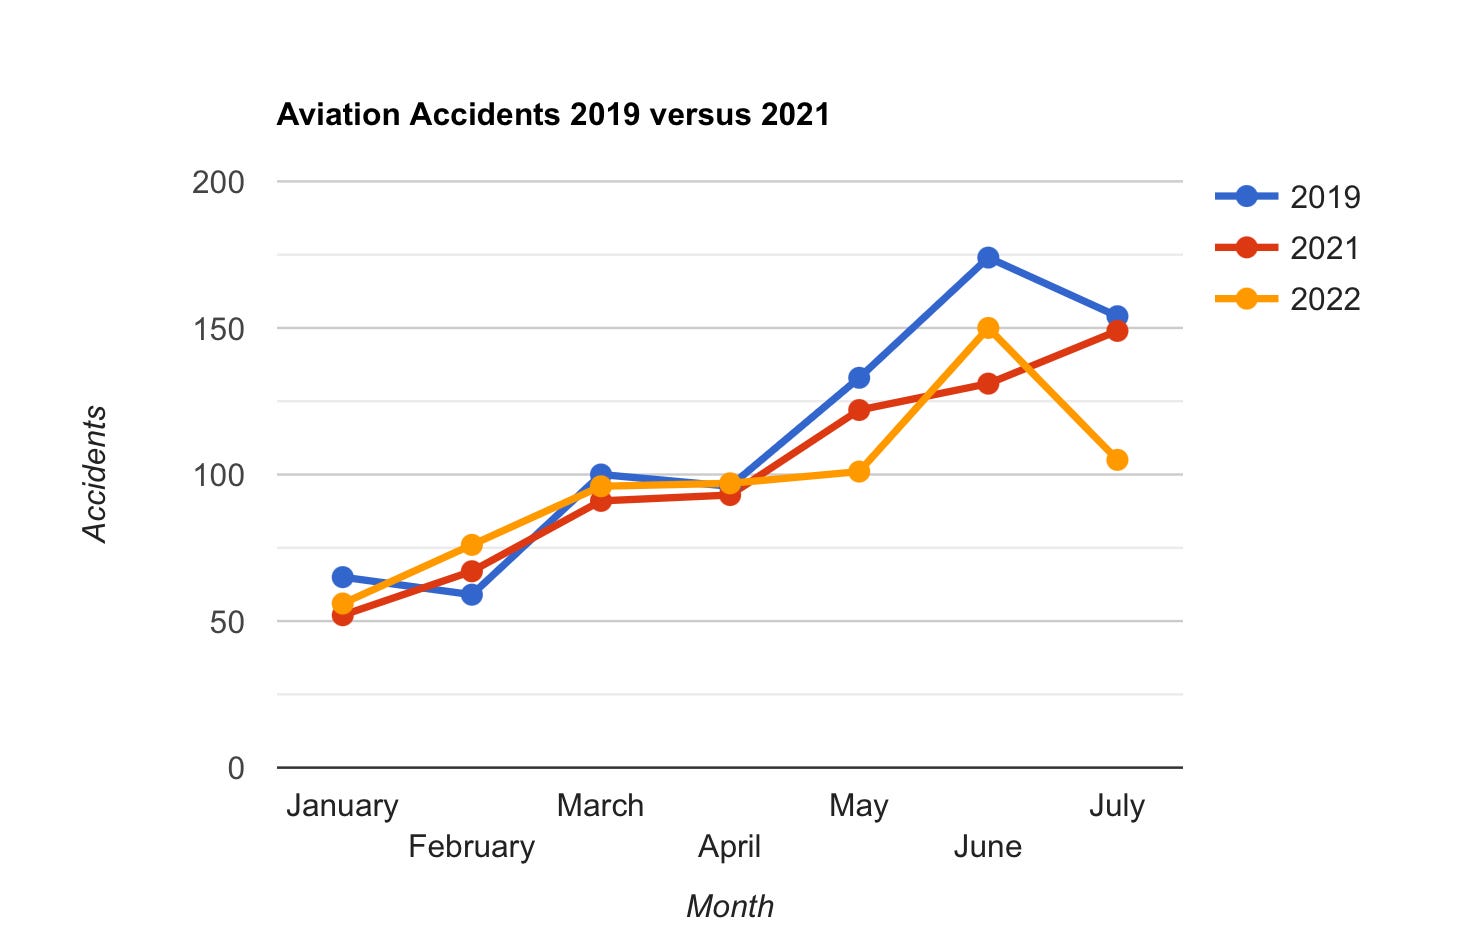
Because we’re now halfway through 2022, why don’t we include those numbers?
January 2022: 56
February 2022: 76
March 2022: 96
April 2022: 97
May 2022: 101
June 2022: 150
July 2022: 105 (I don’t think this is a complete dataset)
Adding these numbers to the graph:
2019: 1,304
2021: 1,223
2022: 681
So here we have it, the pure numbers taken out of the CAROL database. Hopefully within the next few months the numbers will come out with how many hours flown, and we can compare that way. But my gut tells me we didn’t have as many flight hours flown in 2021 as 2019, and that a difference of only 81 means there was a uptick. Maybe I’ll revisit this and add in 2020 to see how that compares as well.
Please add your thoughts in the comments.
Does something like this get you anywhere? https://www.faa.gov/air_traffic/by_the_numbers/media/Air_Traffic_by_the_Numbers_2022.pdf
Seems there were fewer overall flights?
I found your blog in Dr. Stillwagon's list of recommended reads.
I am SO grateful that there is an experienced pilot like yourself paying attention to these potential "vaxxidents."
I will post another comment with some of the links I've saved related to medical emergencies on airplanes. Perhaps they will inspire a future post!